Without Standards, There Can Be NO Improvement
Annah Godwin
When processes don’t possess stability, reliability, and repeatability, what is the first action to take?
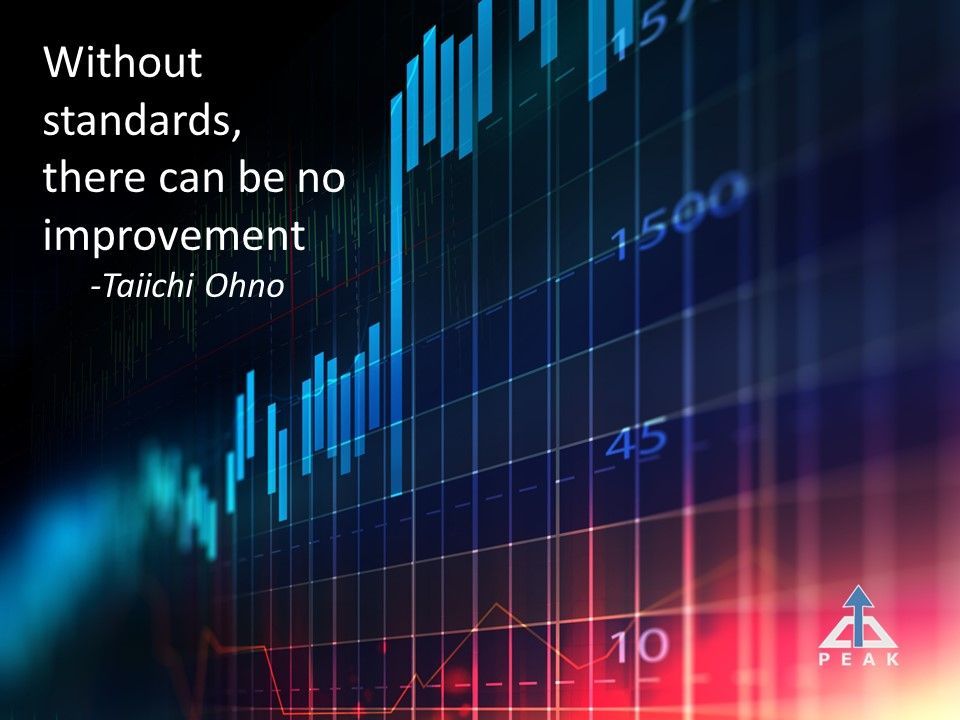
I learned Taiichi Ohno’s famous quote, “Without standards, there can be no improvement”, very early in my lean journey. Every time I read it, I always wondered how you would improve a process when things are not standard. When processes don’t possess stability, reliability, and repeatability, what is the first action to take? Fortunately, this is not an issue we run into very often since most processes have standards or at minimum are somewhat repeatable and stable. This stability makes it easier to see the process, to create a map like a SIPOC, value stream map, or flow diagram, and to make changes for improvement. However, that leads me to consider how someone makes improvements in unstable, non-repeatable processes.
- Is it possible to make improvements in that type of process?
- Does each person make changes that focus on improving their steps and process?
- What tools do you deploy when the processes aren’t standard, stable, and repeatable?
- How do you make improvements when there is little to no stability?
Thankfully these questions usually represent the exception rather than the rule of thumb, but it is still good to know what to do when the process isn’t standard. Knowing what tools to pull from the lean toolbox will help untangle an unstable, unpredictable process and transform it into one that is more stable, reliable, and predictable.
Several years ago, I was working with a healthcare organization that wanted to roll out lean methodologies to physician’s offices. After some in-depth discussions, we decided the first area of focus would be the front-end process. These processes included scheduling, phone calls, patient check-in, paperwork intake, along with reordering materials for the front office. We launched the 5-day kaizen by providing a brief introduction on mapping and kaizen and then headed out to observe the processes. Half the group observed the process of answering phone calls and scheduling, while the second group observed patient check-in and the general layout of the office. After about 30 minutes we switched processes, observed another 30 minutes, and then headed back to the conference room.
As we started the debrief it became clear that the team was struggling a bit. The same process observed by the two groups looked different. The process variation was very people-dependent, so depending on who was performing the task, determined how the steps were completed. Once I realized what was happening within the processes, I knew my standard approach wasn’t going to fit. Trying to map the process wasn’t going to be the best option. At this point, we altered the course to get the team moving toward some type of improvement plan. Immediately thoughts popped to mind, like brainstorming, affinity diagrams, or fishbone diagrams which would help identify and organize the variations so the improvement plan could be developed and followed. I considered jumping straight into standard work and visuals to create a documented process but felt we might miss some key opportunities without first understanding the variation. After carefully weighing my choices, I decided to pull out the fishbone diagram, otherwise known as the Ishikawa diagram.
If you are not familiar with the fishbone diagram, continue reading this paragraph. If, however, you are familiar, jump to the next paragraph. A fishbone gets its name from its appearance since it looks like the skeleton of a fish. To create the diagram, start by drawing a straight line horizontally across the paper, and at the end of the line write the problem. Now draw 6 lines (3 on top and 3 on bottom) diagonally off the center line and at the end of each line write one of the 6 Ms: Methods, Materials, Machine, Mother Nature, HuMan, and Measurement. You are ready to begin filling in the causes under each of the categories. This example shows a simple fishbone diagram with one cause per category, in real life, there will be several causes under each category.
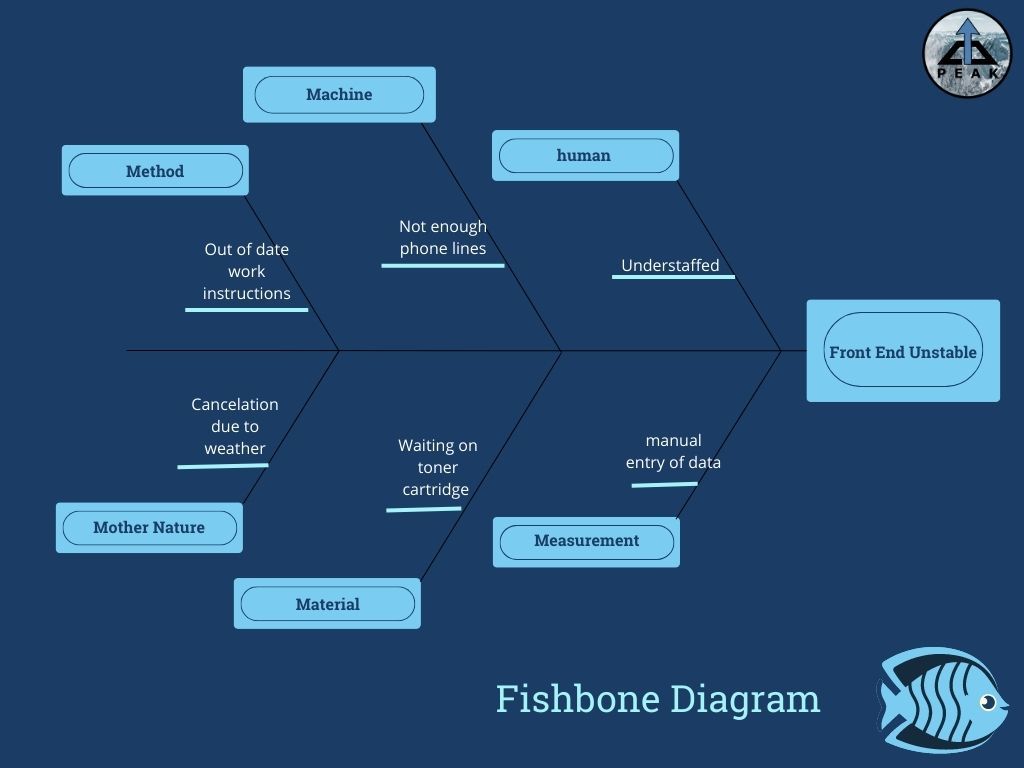
After we drew up the initial schematic of a fishbone on the whiteboard, we were ready to begin populating the issues we saw in the front-end processes. Once all the issues were recorded on the board, we noticed there were some clusters around central themes. We divided up the clusters among the team and started working on solutions to address the root causes. As the week progressed, we started noticing that the improvements were positively impacting the processes, bringing repeatability and stability. By the end of the week, the kaizen team had produced flow diagrams and standard work for the processes, visual controls, and standardized work, along with 5S organization to help with supplies. On the final Gemba walk you could see the flow, stability, and standards.
That story brings me back to the quote about standards and improvements. I believe standards give a process structure that enables improvement to occur, but when there are no standards or stability, improvement can still occur. The first improvements must make the process stable and start to build the standards. Bringing that stability will in many cases make a huge impact on a broken process. So, the next time you find yourself in a Gemba that is hard to follow and map, maybe it is the right time to deploy a simple brainstorming activity, affinity diagram, or a fishbone diagram. Any of those tools will help you see the issues that need improvement to establish the first standards.
Points to Ponder:
1. What tools do you use to help bring stability to an unstable process?
2. How often do you see processes that struggle with stability or lack standards?
3. Should creating standards be part of the requirements for starting new processes?
Peaks and Valleys.....


