Embracing Slower Times - Part 7: Building Resiliency for Long-Term Success Applying Value Stream Maps
Annah Godwin
This is Blog 7 in a 13-part series "Embracing Slower Times: Building Resiliency for Long-Term Success." In this week’s blog, I will discuss using the slow times to build a Value Stream Map. Creating an up-to-date, current state Value Stream Map with future improvements identified can help drive improvements both now and, in the future, as well as reducing chaos. Time and resource hurdles often slow the rate of implementation, meaning that slower times are the perfect moment to review, update, and improve your value stream.
This is the 7th of a 13-part series entitled “Embracing Slower Times: Building Resiliency for Long-Term Success.” For some companies, there is a normal ebb and flow to their demand, a seasonality of their products. For other companies, demand is more level and predictable. Understanding what to do with excess resources and capacity when things slow down can be a bit of a challenge. In this week’s blog, I will discuss using the slow times to build a Value Stream Map. Creating an up-to-date, current state Value Stream Map with future improvements identified can help drive improvements both now and, in the future, as well as reducing chaos. Time and resource hurdles often slow the rate of implementation, meaning that slower times are the perfect moment to review, update, and improve your value stream.
What is a value stream map? A value stream map is a tool used in lean manufacturing and continuous improvement to identify the customers and vendors connected to the process, the current steps within a process, and the systems that bind all three together. All this information comes together to create a drawing that represents how things currently flow and move from area to area.
There are a few rules which are typically followed in creating a value stream map. These include drawing the customers in the far top right corner and the suppliers in the far top left corner. Between the customer and the supplier are the information systems used to connect the company, the customer, and the supplier. This graphic depicts the information flow between software systems for inventory management, emails between customers or suppliers, printed order sheets and printed shipping labels, etc.
The bottom of the value stream map includes the process steps required to make the product or provide the service. Each value-added step for each process includes data boxes which contain pertinent information on the specific process step. This data can vary from process to process but typically includes, at minimum, changeover time, number of employees, cycle times and first pass yield (FPY). In some cases, a map may be created without data blocks. This is typically done when the process is unstable or if the map is very high-level map and spans multiple plants.
When creating a map, you should have 4 to 10 team members to represent a cross-section of the various processes included in the map. Be sure to include someone from the upstream and downstream areas so the overall impact of issues included in the map is fully understood. Ideally, depending on the company’s level of comfort, the team should include vendor and customer representatives.
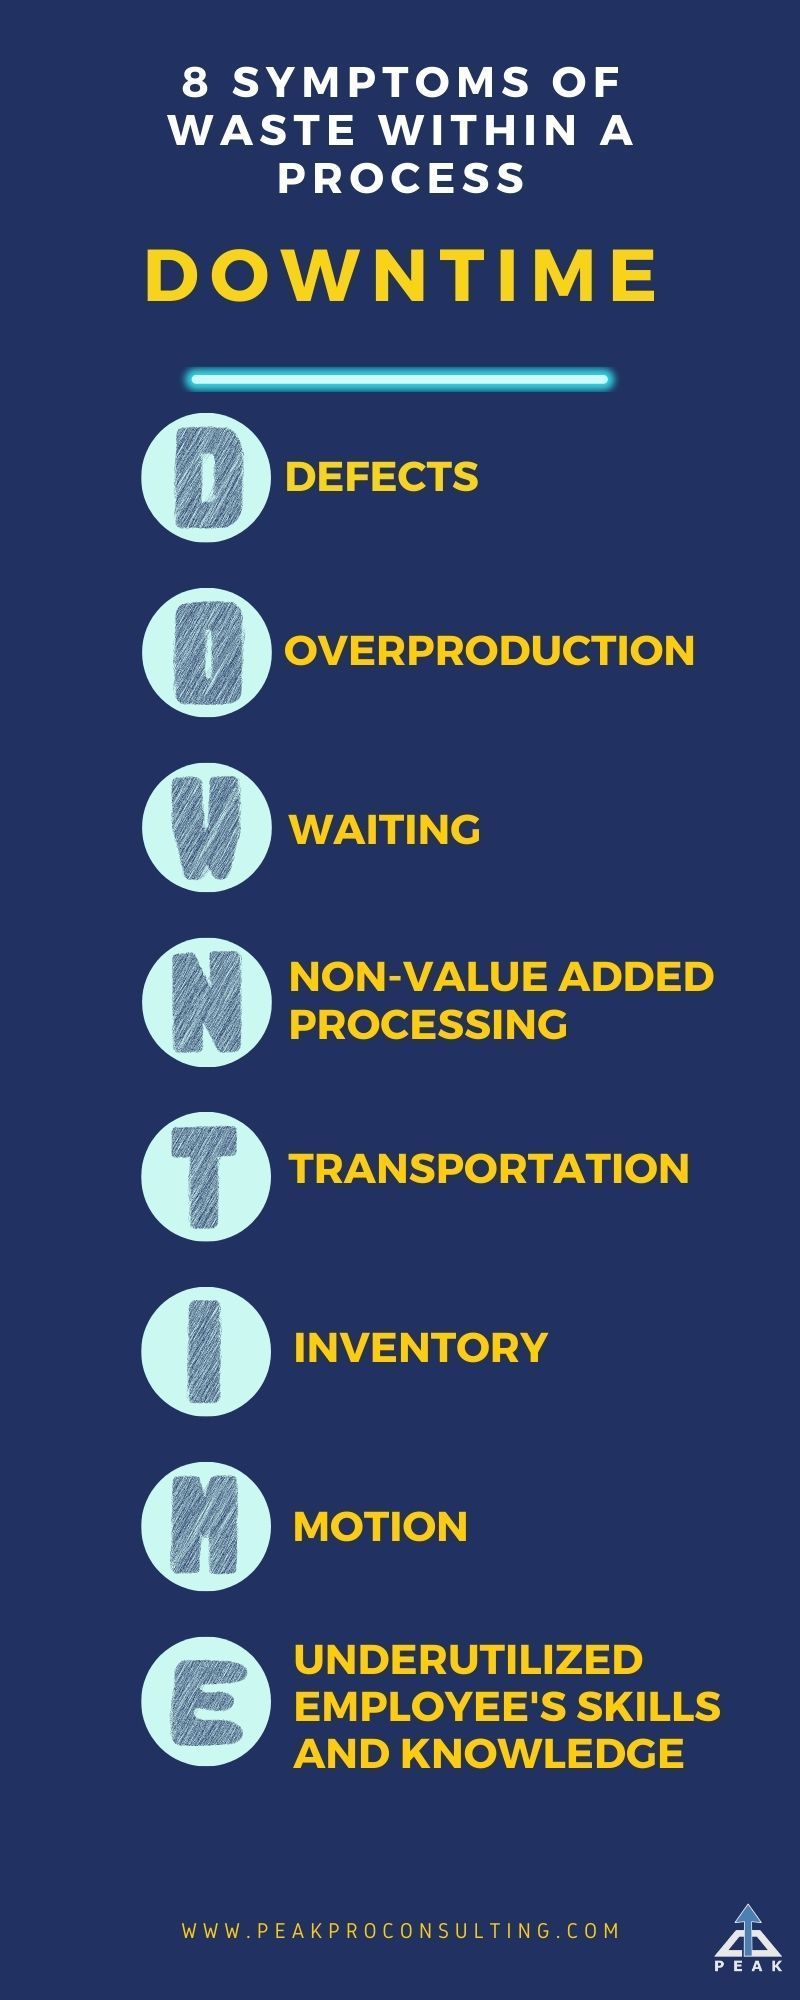
With the team selected, it is time to draw. There are a couple of ways to create the map, depending on the value stream itself. When possible, I take the team to Gemba. At the Gemba, everyone makes observations, records data for the process boxes, and collects samples of paperwork and information used in the process. However, if the process is brand new or going to the Gemba is not an option, then the team will have to discuss the steps within the process, the customer needs, and the vendor’s capabilities. Once we have a consensus on the steps, sequence, and information flow, it is time to populate the data boxes. When the current state map is complete, the team identifies issues, gaps, and problems within the process. The items they identify are written on star-shaped graphics known as Kaizen starbursts. Most often, these starbursts key in on wastes within the process. A thorough understanding of the eight wastes can help focus and categorize these discussions.
Once identified, the issues and opportunities should be reviewed and prioritized. There are many tools which can be used to prioritize a value stream map’s kaizen starbursts. One of my favorites is the four quadrants map. To create the quadrants, let one of the axes be impact ranging from high to low and the other be cost, also ranging from high to low. The four quadrants are created by creating boxes consisting of the following areas on the graph: low cost and low impact, low cost and high impact, high cost and low impact and high cost and high impact. The principle is to prioritize improvements with high impact and low cost. Once the quadrants are drawn, starbursts are added and prioritized, the new future state map is generated.
In addition to helping the kaizen team understand the current state and opportunities, the map is also an excellent tool for communicating with the broader organization. The maps are shown to team members throughout the process to drive discussion on implementation plans and timing for improvements. These discussions will help generate support and buy-in from team members.
No organization likes slowdowns and the problems that they bring, but the organization that leverages the time and additional resources to drive improvement will be the ones that emerge from the slowdown strongest. Understanding our processes and the steps we can take to make them quicker, safer, and easier, with higher quality, more communication, and better visuals should excite all team members during the activities, and all of the shareholders once the results begin pouring in after demand returns.
Which processes should we start with? Those that would benefit most from more development, better efficiencies, better quality, or faster lead times.
One additional tip for companies that have seasonal demand: keep a dry-erase board next to the value stream map to track a running list of problems. In periods of high demand when there aren’t resources or time, but when problems are most clearly seen, grow the list with details of the issues, details on what and why and the consequences. When demand begins to slow, have the team prioritize the list to resolve problems and implement improvements. This work helps to transform the current state map into the new future state. Additionally, I have found that team members enjoy this approach because they know their problems and issues will be addressed, even if not immediately when they happen.
Hopefully, you have found this blog interesting and helpful! Feel free to post your comments on how you've used value stream maps in times of lower demand to help make improvements. As always, if you have questions or if you'd like more information on value streams, waste elimination, or the eight waste please feel free to reach out to me at Peak Productivity.
Peaks and Valleys.....
